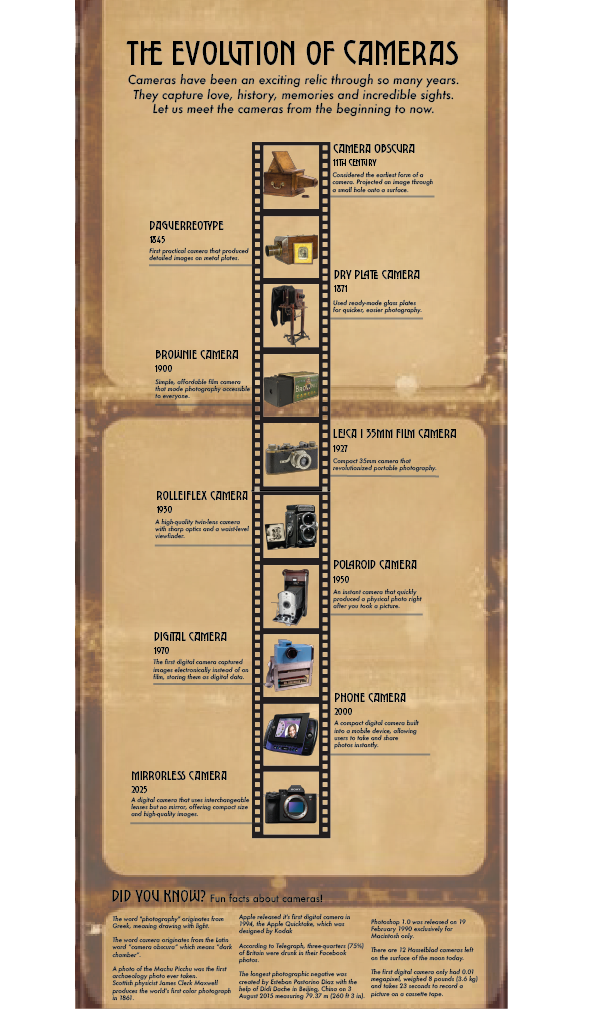
Graphics made by me from classes i’ve taken at Michigan State University. It includes infographics, drawings and media graphics.
Photoshop Project for JRN 336
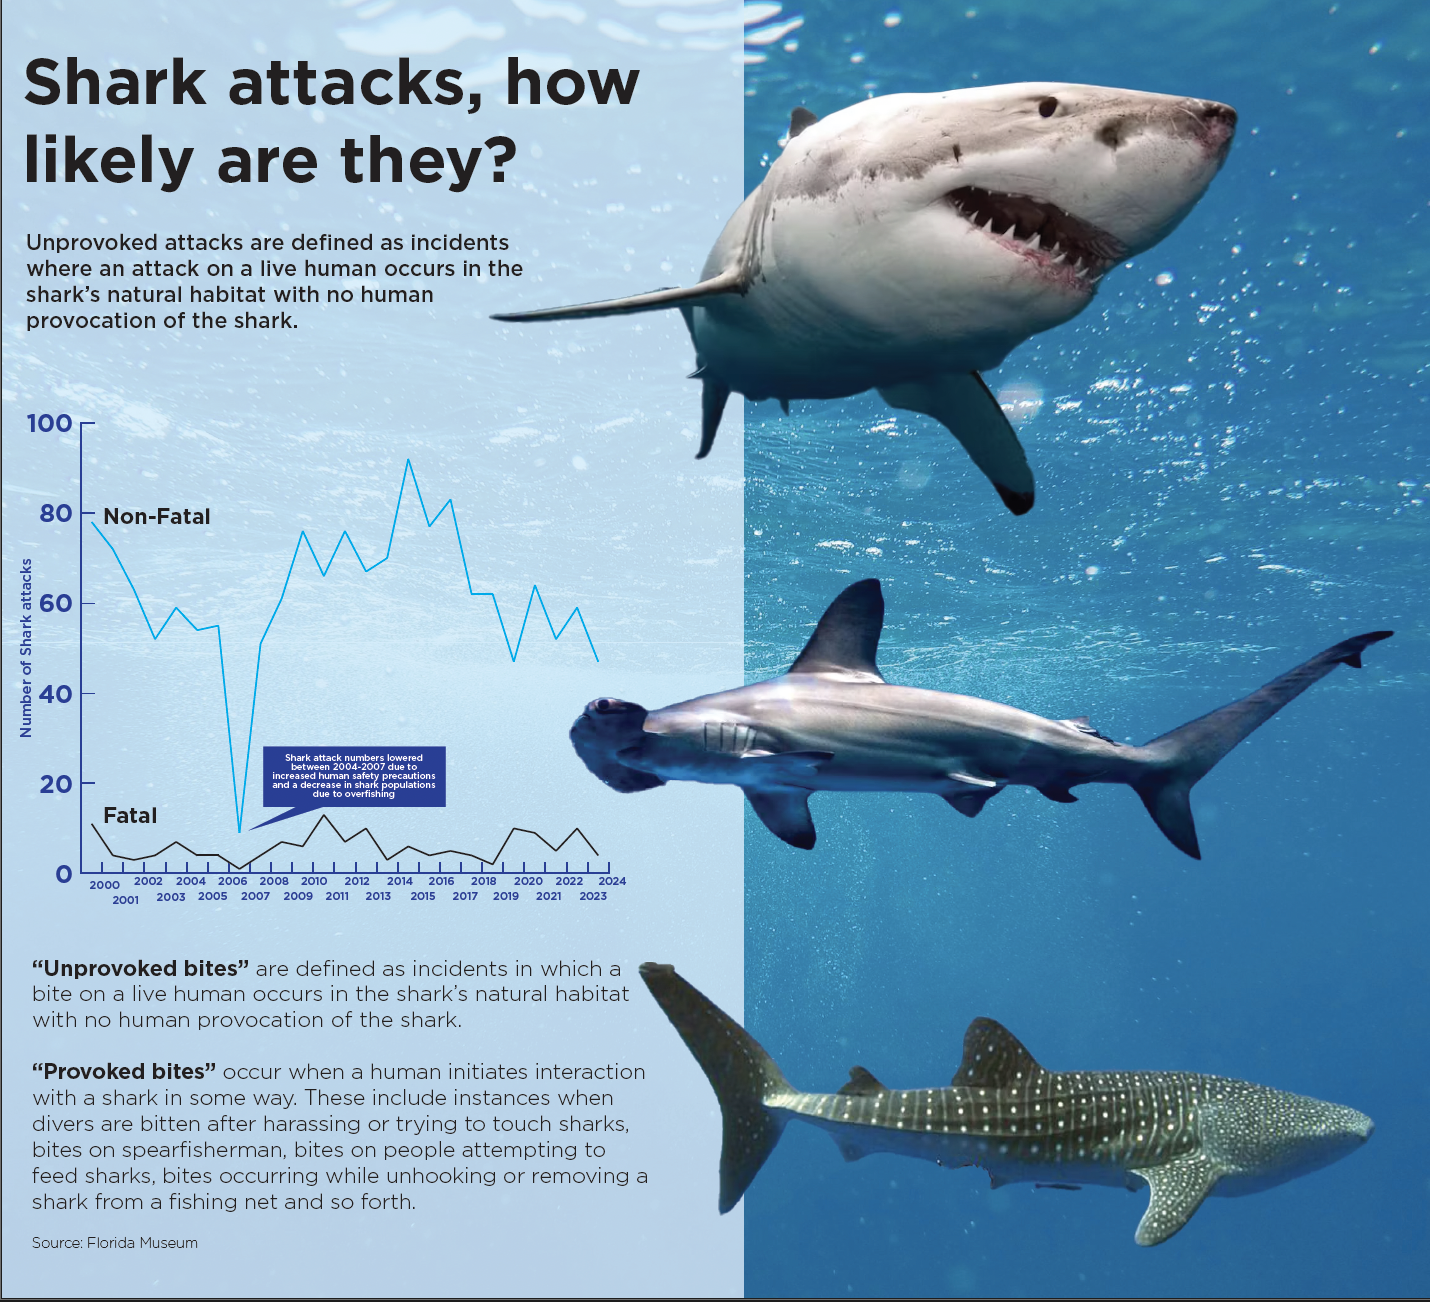
Fever Chart of Shark attacks bewteen 2000-2024. Made with Adobe Illustrator.
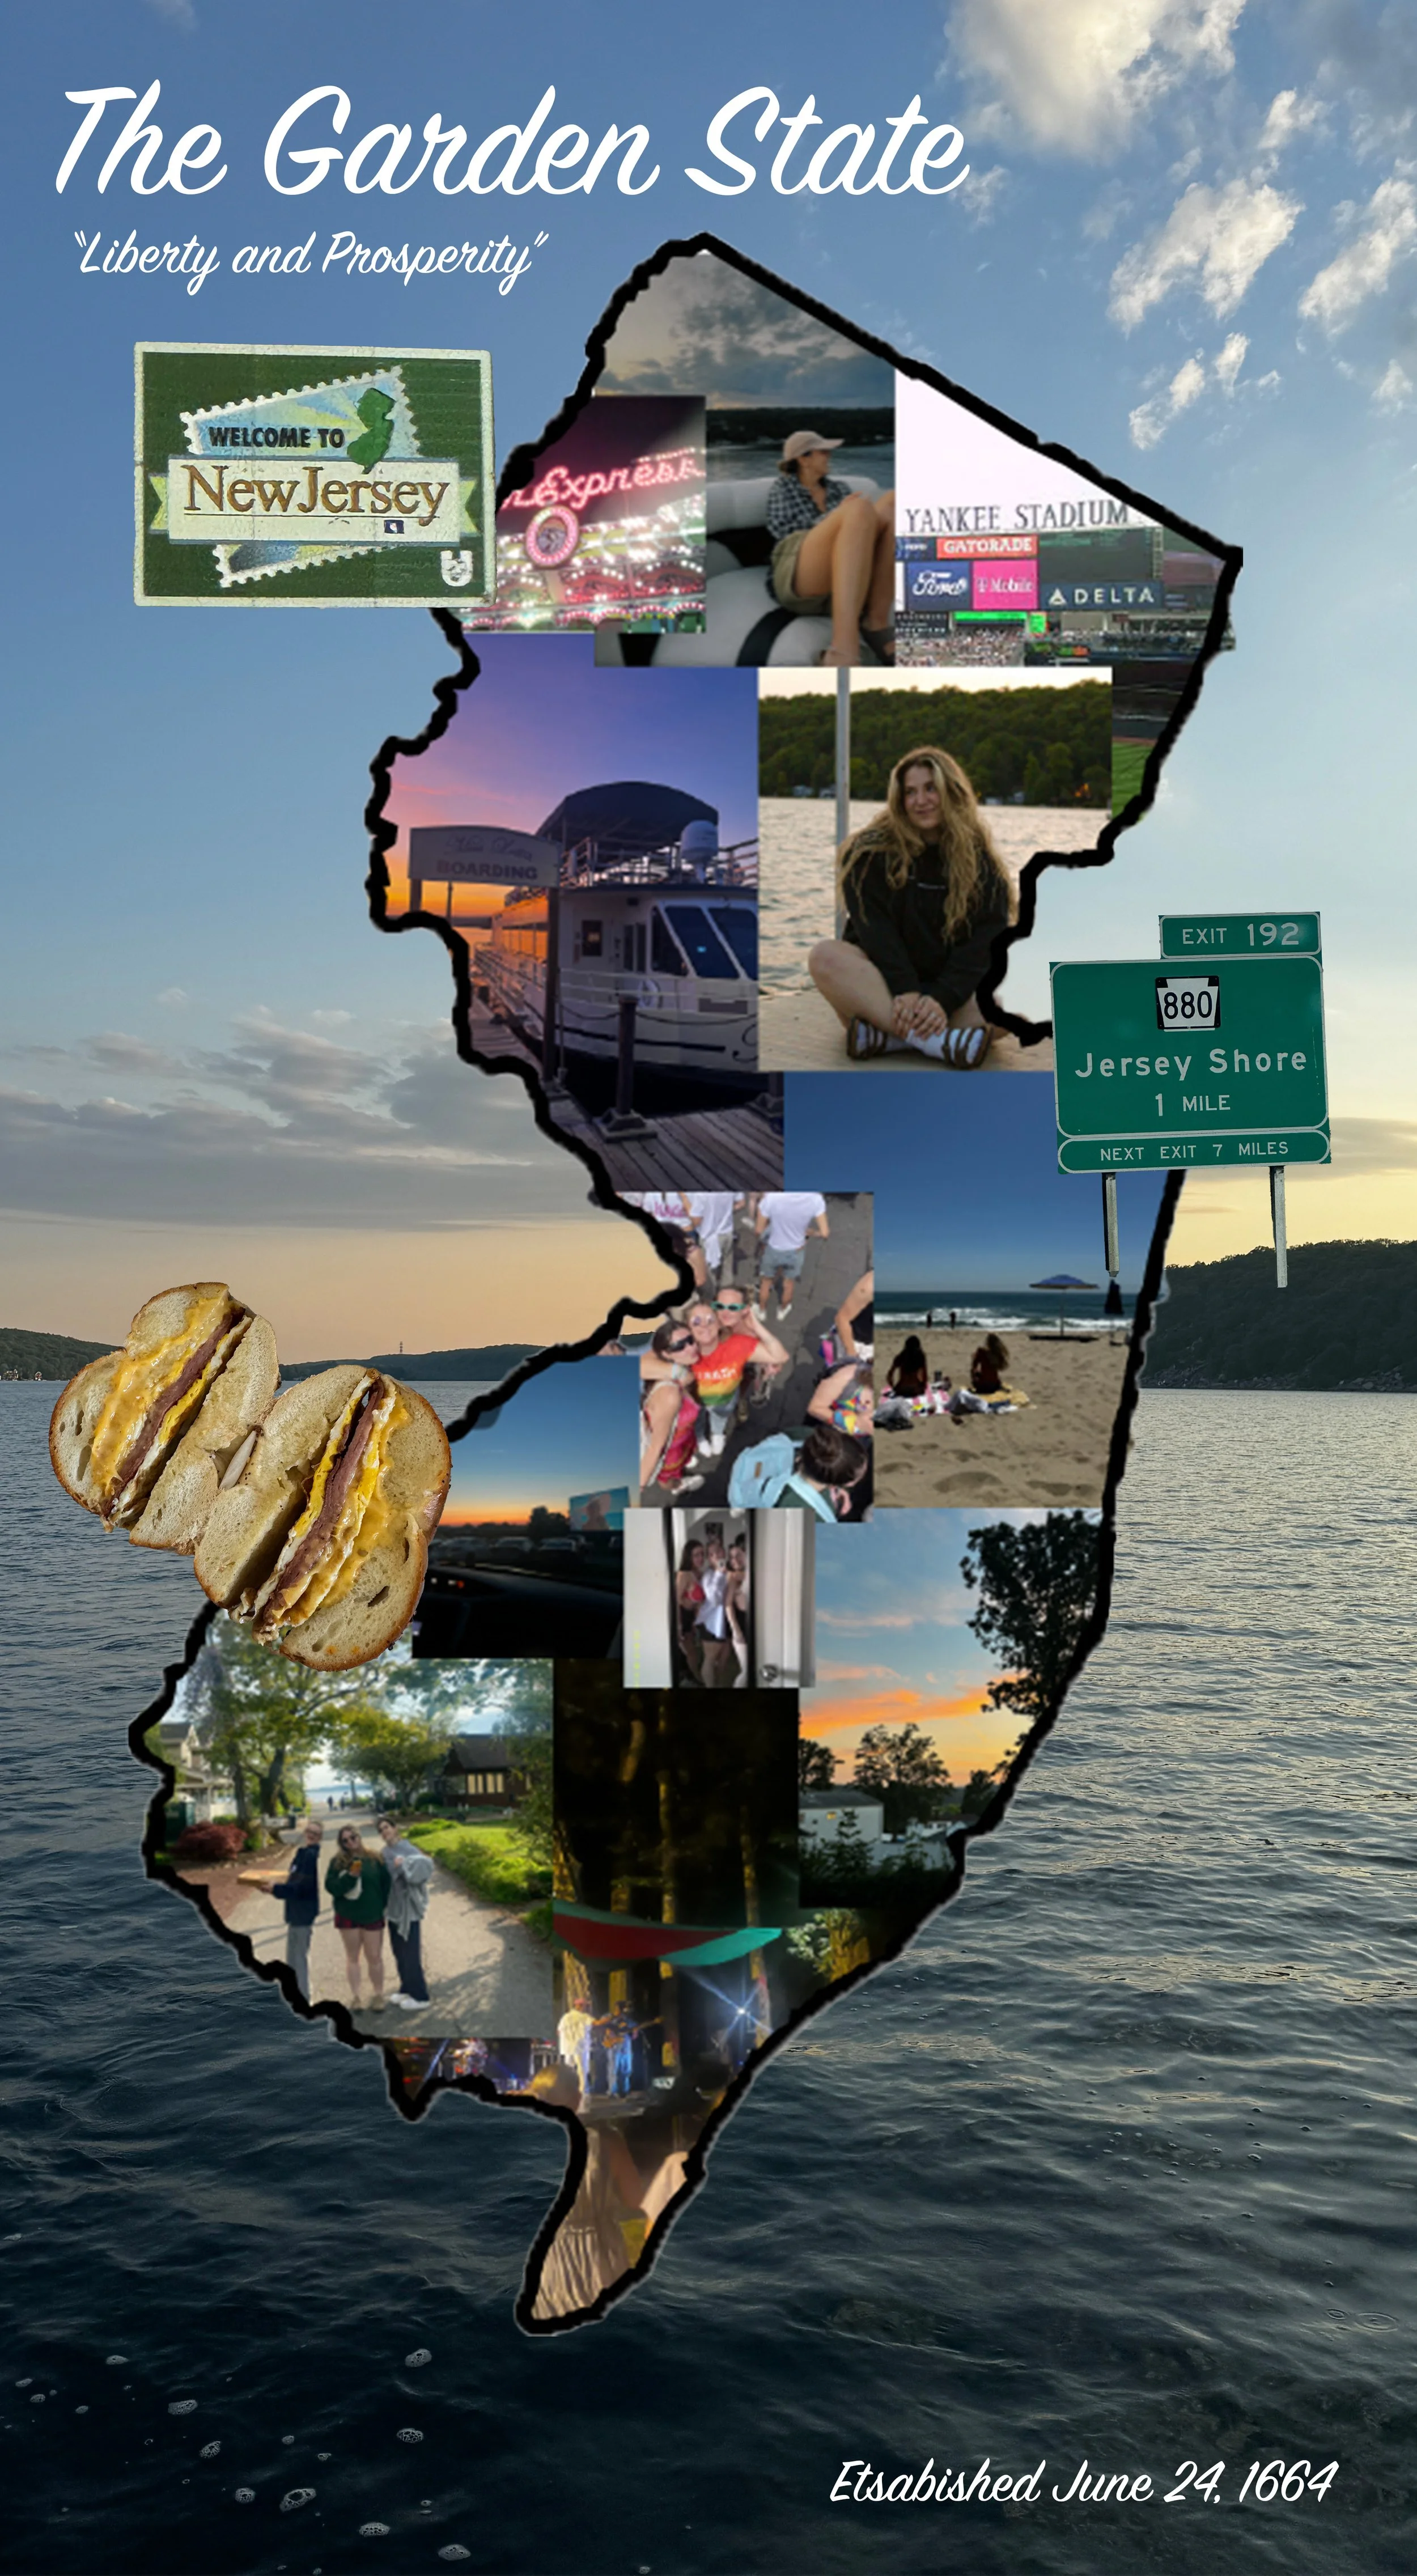
FaceBook Cover for JRN 336

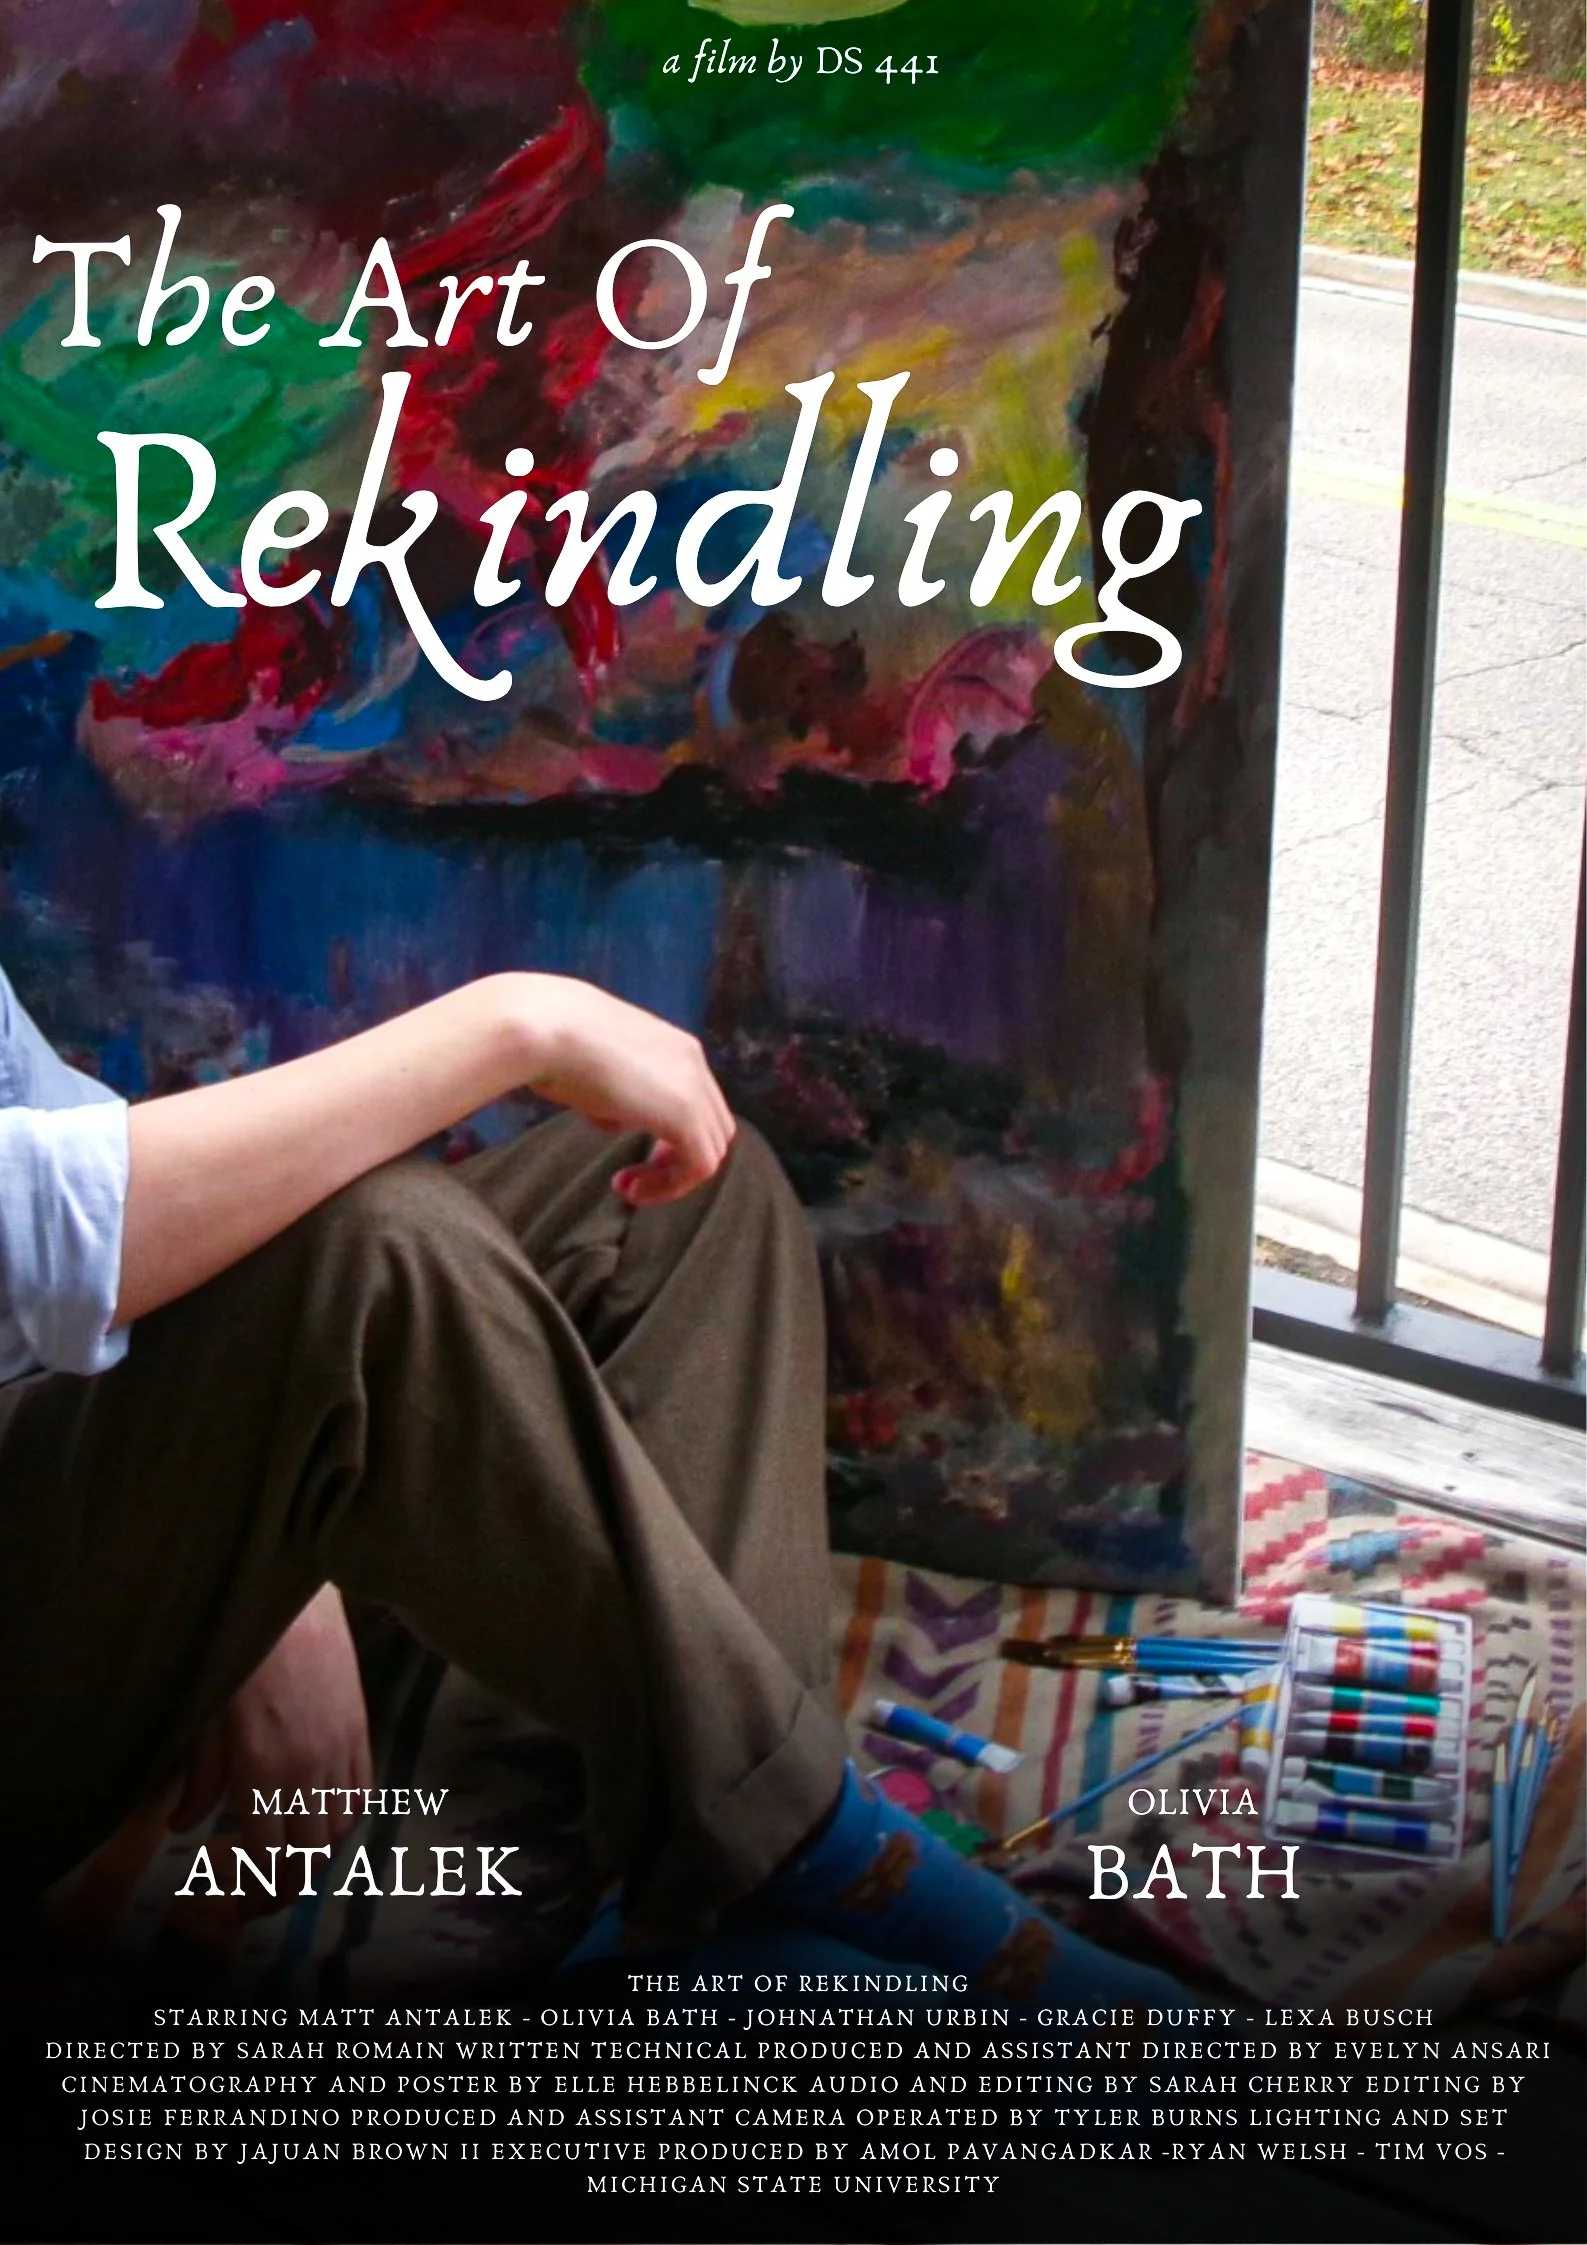
Movie Poster for Short Film
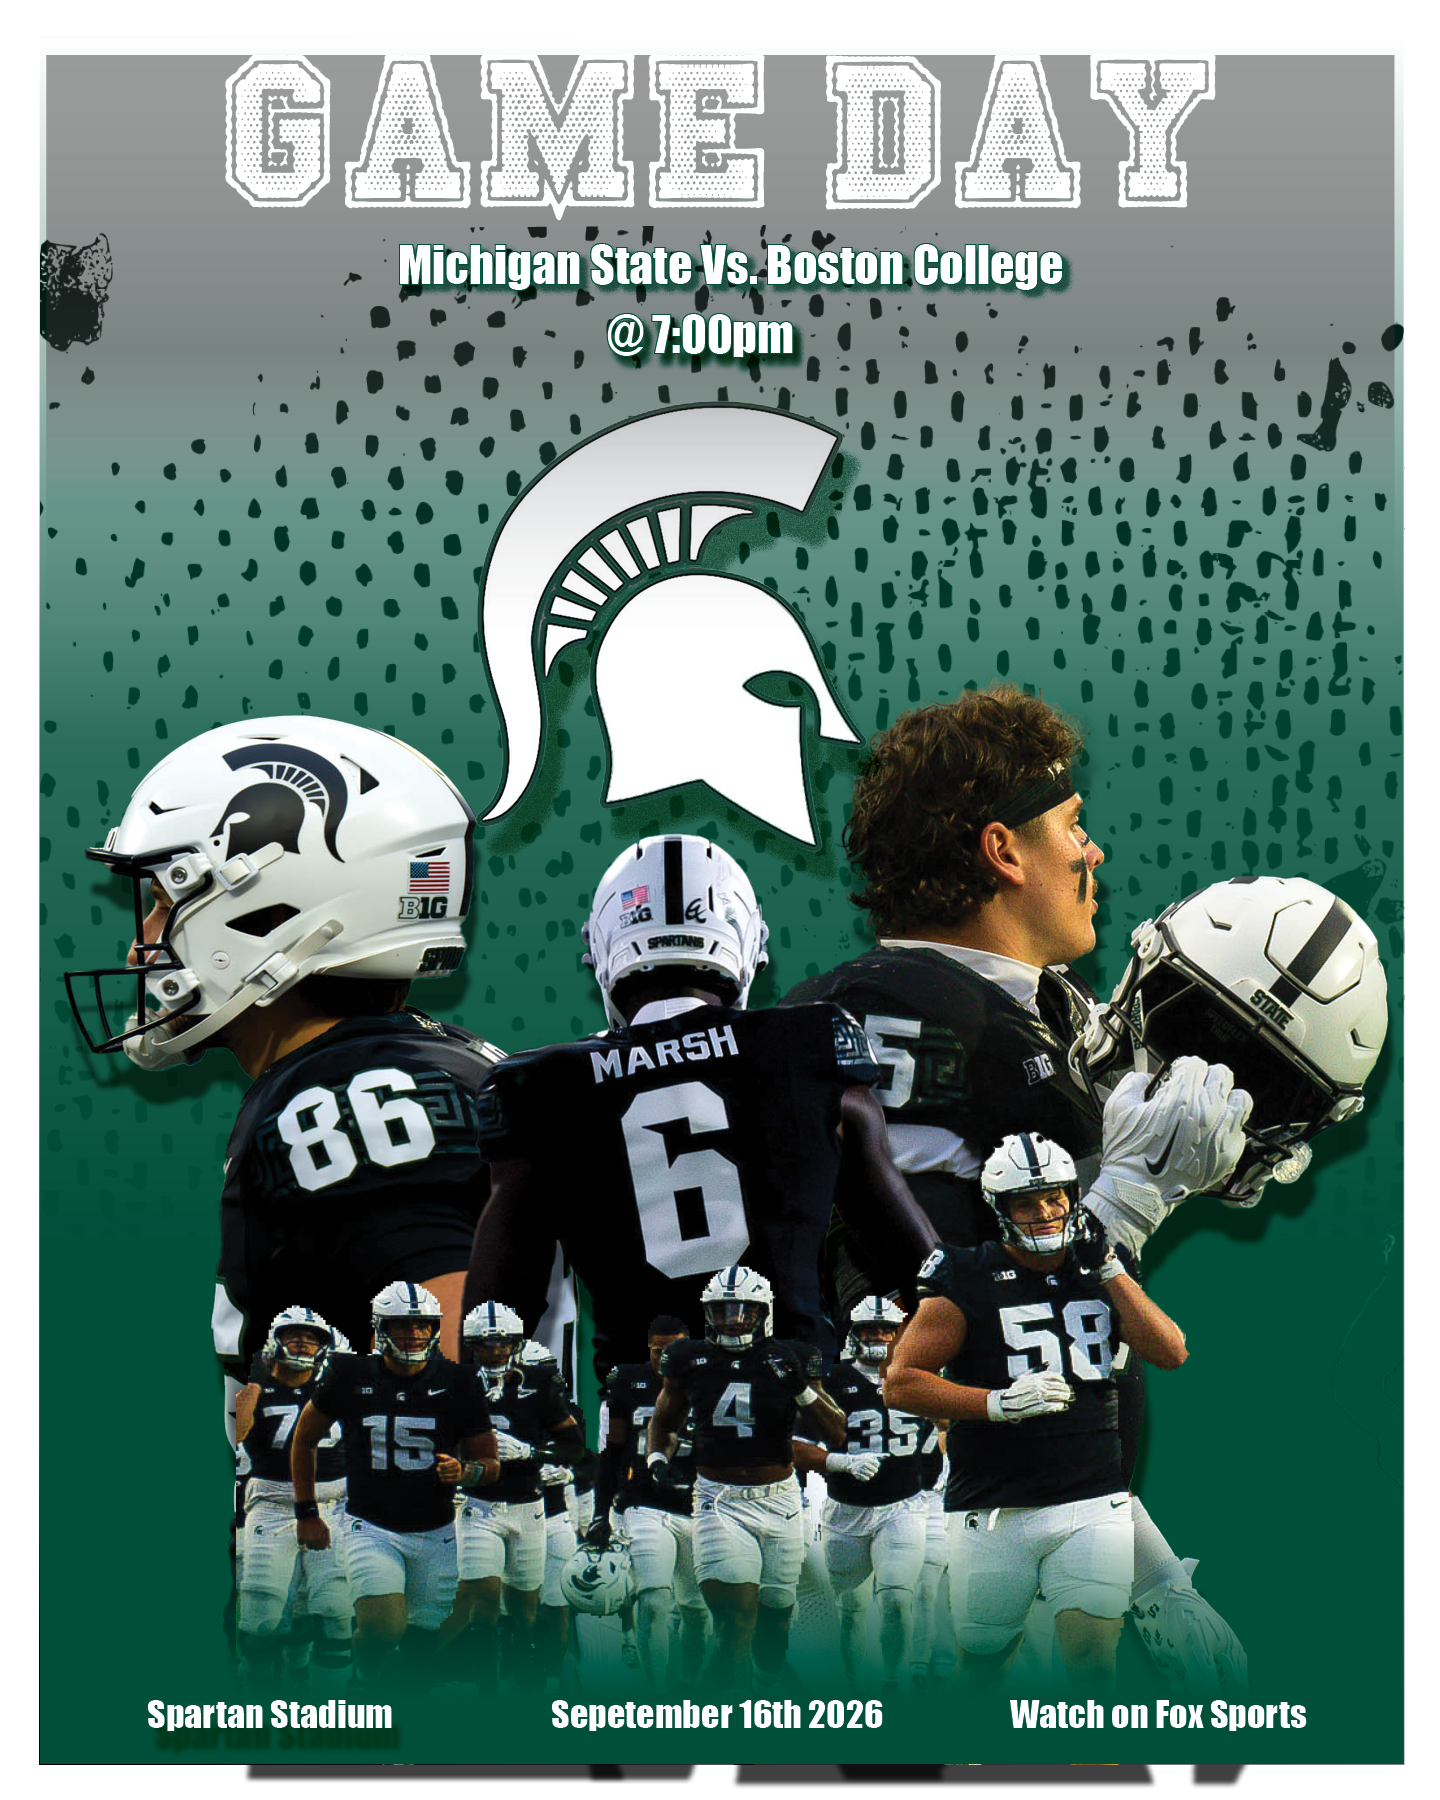
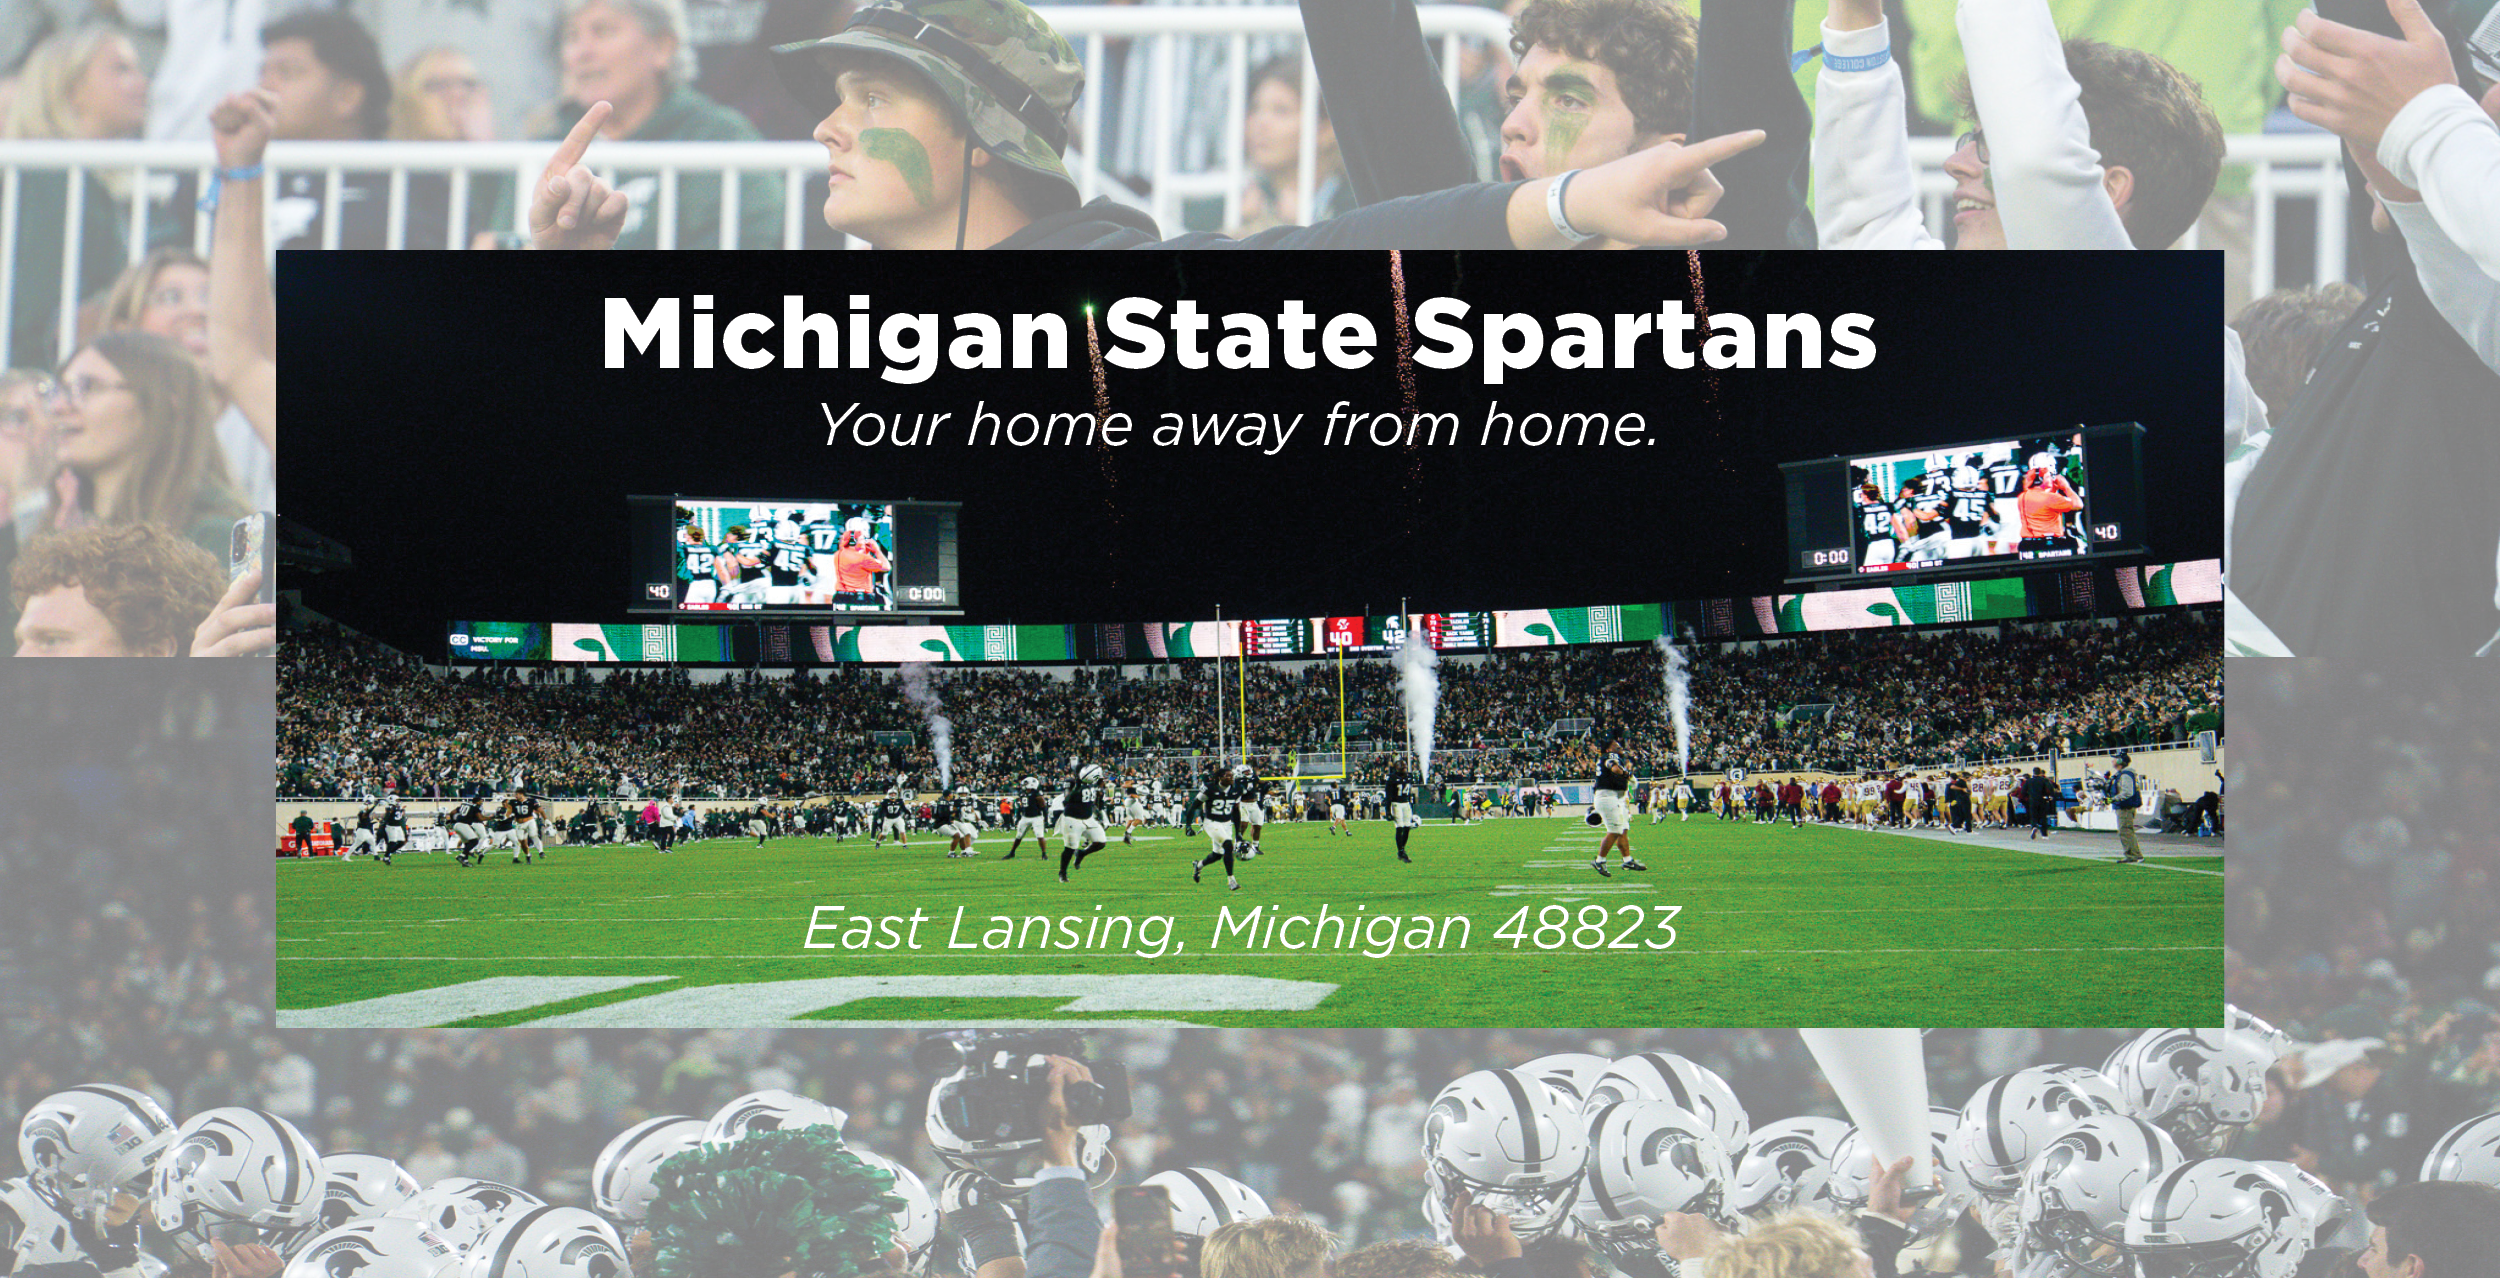
Social Post for JRN 336

Heat Map and Tab Chart of New Jersey Counties and Municipals over what they call a breakfast sandwich meat. Made with Adobe Illustrator.
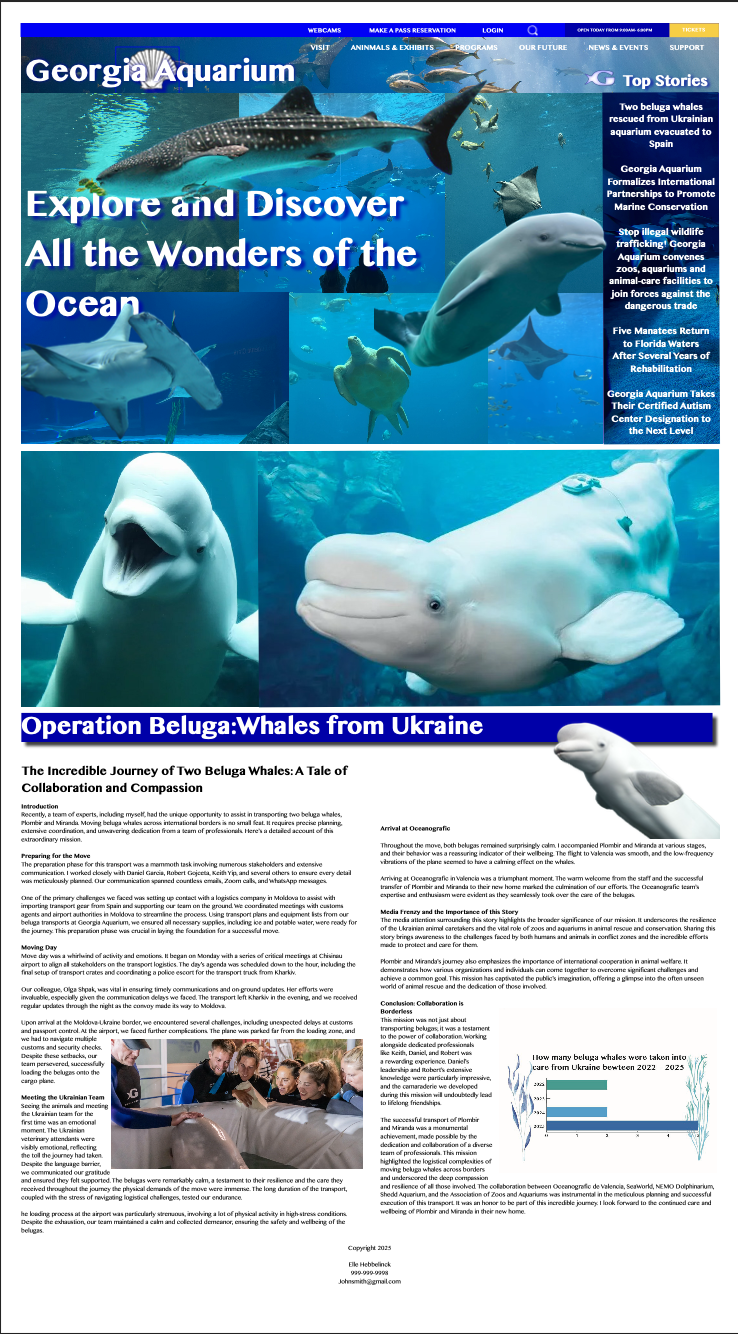
Website Recreation of Georgia Aquarium featuring a Beluga Whale main story. Made with Adobe InDesign.
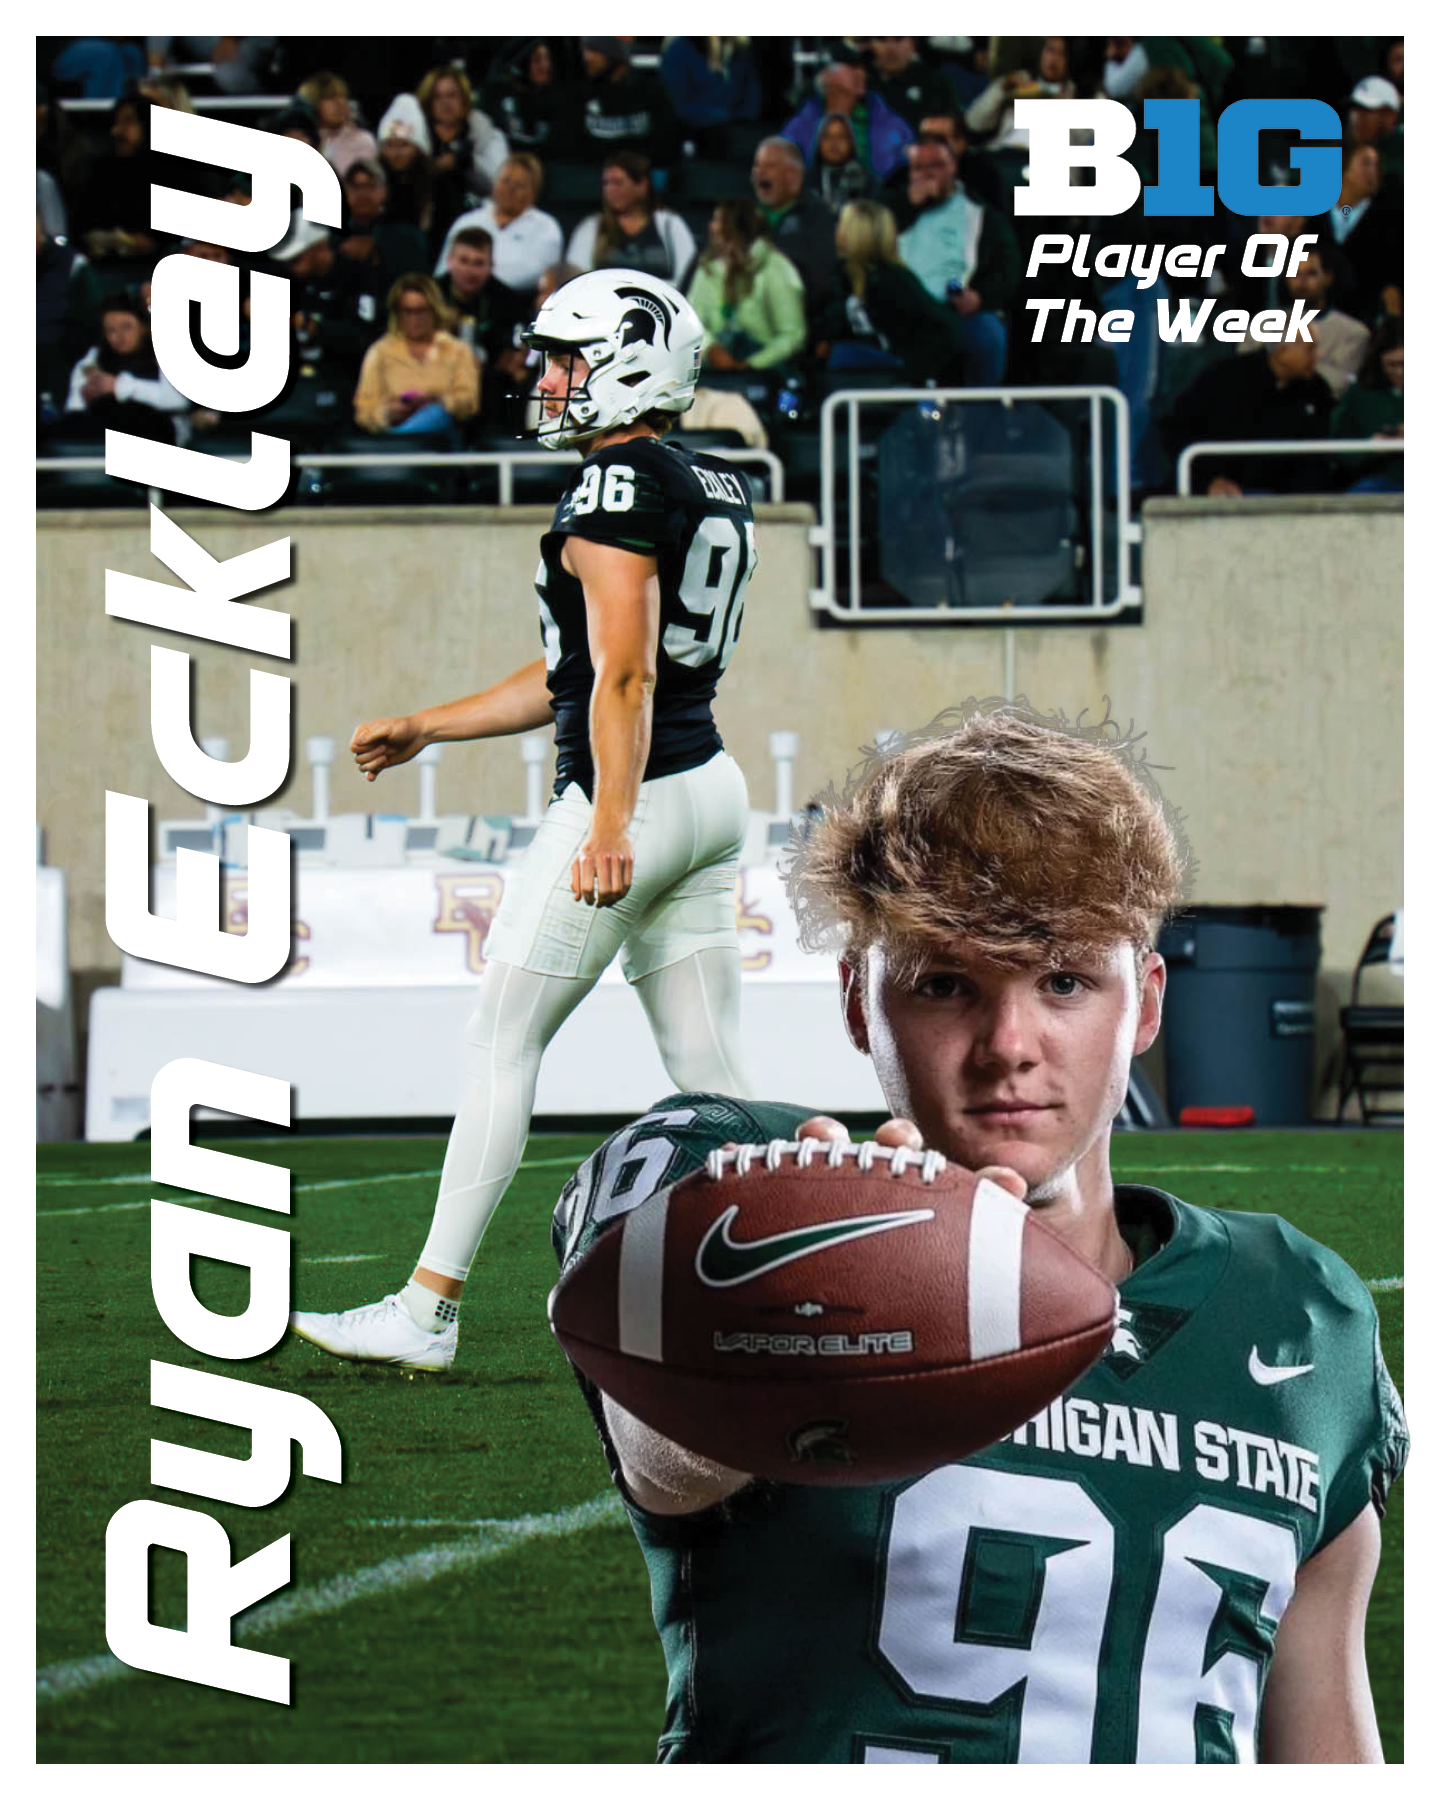
Social Post for JRN 336
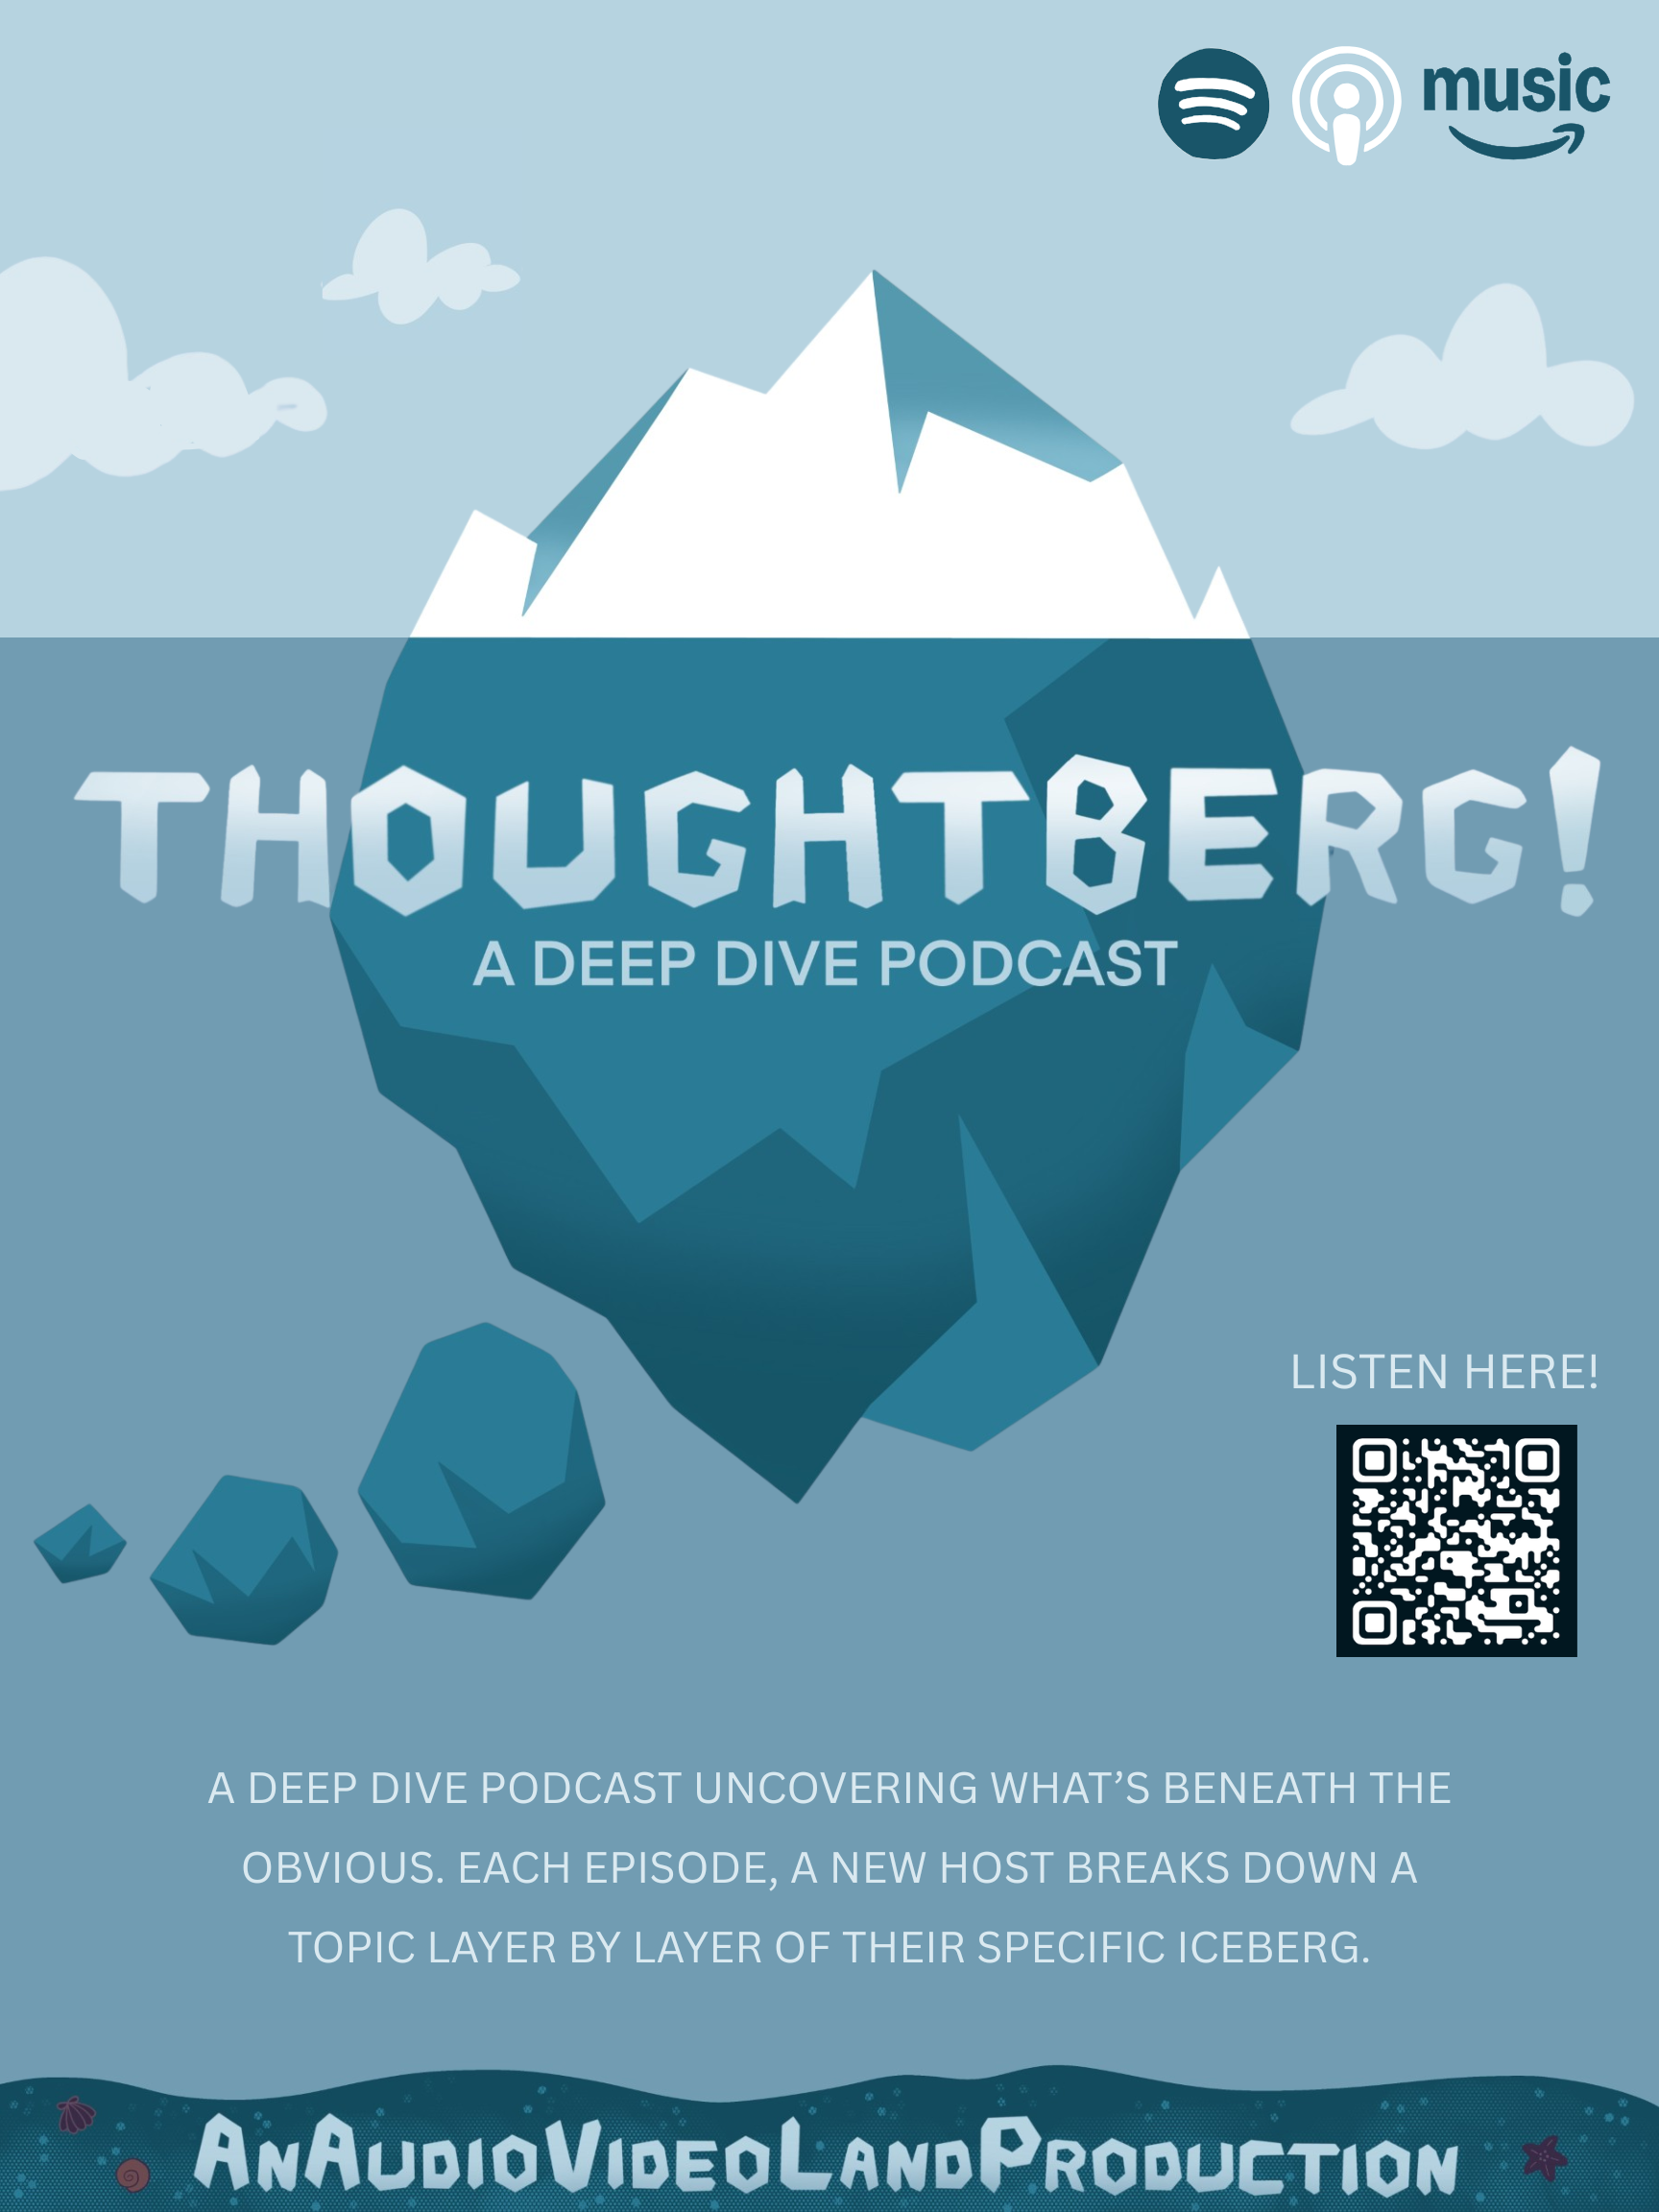
Poster for Class Podcast Thoughtberg

Graphic 1 of Tab chart project for My Teacher's Top 100 songs. Made With Adobe Illustrator.

Logo for JRN 336

Graphic 2 of Tab chart project for My Teacher's Top 100 songs. Made With Adobe Illustrator.
Movie Poster for Short Film
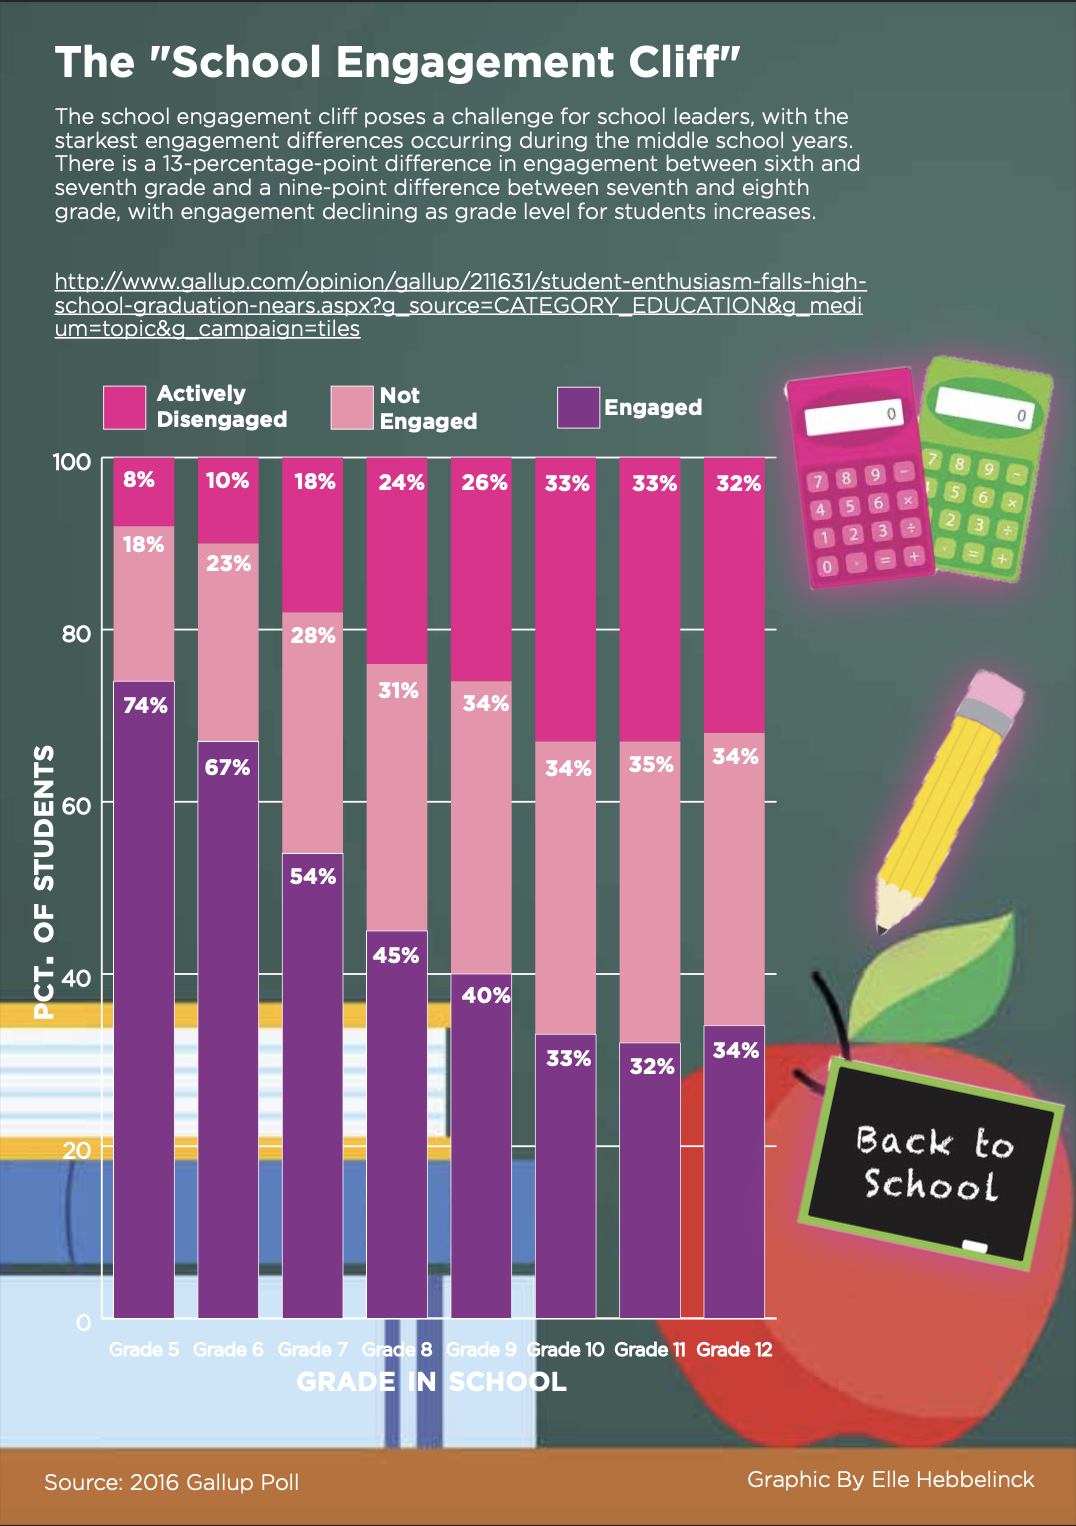
Stacked Bar Chart of School Engagement. Made with Adobe Illustrator.

Bar chart of the top 5 passing yard leaders in the NFL. Made with Adobe Illustrator.

MSU Map highlighting entertainment on campus. Made with Adobe Illustrator.

CFL Football traced by me. Made in Adobe Illustrator.